|
Discoverer Tutorial
Index
- Introduction
- Example 1: Identification of the putative Pdr1p binding site, based on microarray results
- Example 2: Identification of the putative Aft2p binding site, based on direct and indirect evidence
- References
1. Introduction
This tutorial exemplifies the use of the motif discovery algorithm MUSA
[1], a tool available at DISCOVERER, in the prediction
of the binding site of a specific transcription factor based on the
analysis of the promoter regions of its target genes. This process will
be followed for two real case-studies, with different characteristics,
while major assets and limitations of this procedure are discussed.
2. Example 1: Identification of the putative Pdr1p binding site, based on microarray results
In this example, the list of genes up-regulated in response to the expression of a point mutation in the PDR1 gene, encoding a transcription
factor involved in Pleiotropic Drug Resistance in yeast, is tested [2]. This point mutation, named PDR1-3, leads to the
expression of the Pdr1p transcription factor in a permanently active form. Thus, the comparison between wild-type and PDR1-3 expressing cells leads
to the identification of the Pdr1p target genes. Through this strategy, 25 Pdr1p-target genes were identified and this gene-list is used herein to
predict in silico the Pdr1p binding site.
The dataset used in this example can be found here and the output obtained can be found here.
MUSA is used to analyse the referred Pdr1p-target list (obtained by clicking Sample Data in MUSA's input page), using the default parameters.
A table is retrieved as result, displaying the
identified motifs, clustered in families and represented by a Position Weight Matrix description (Figure 1).
Presumably, the first motif(s) obtained will correspond to the Pdr1p binding site.
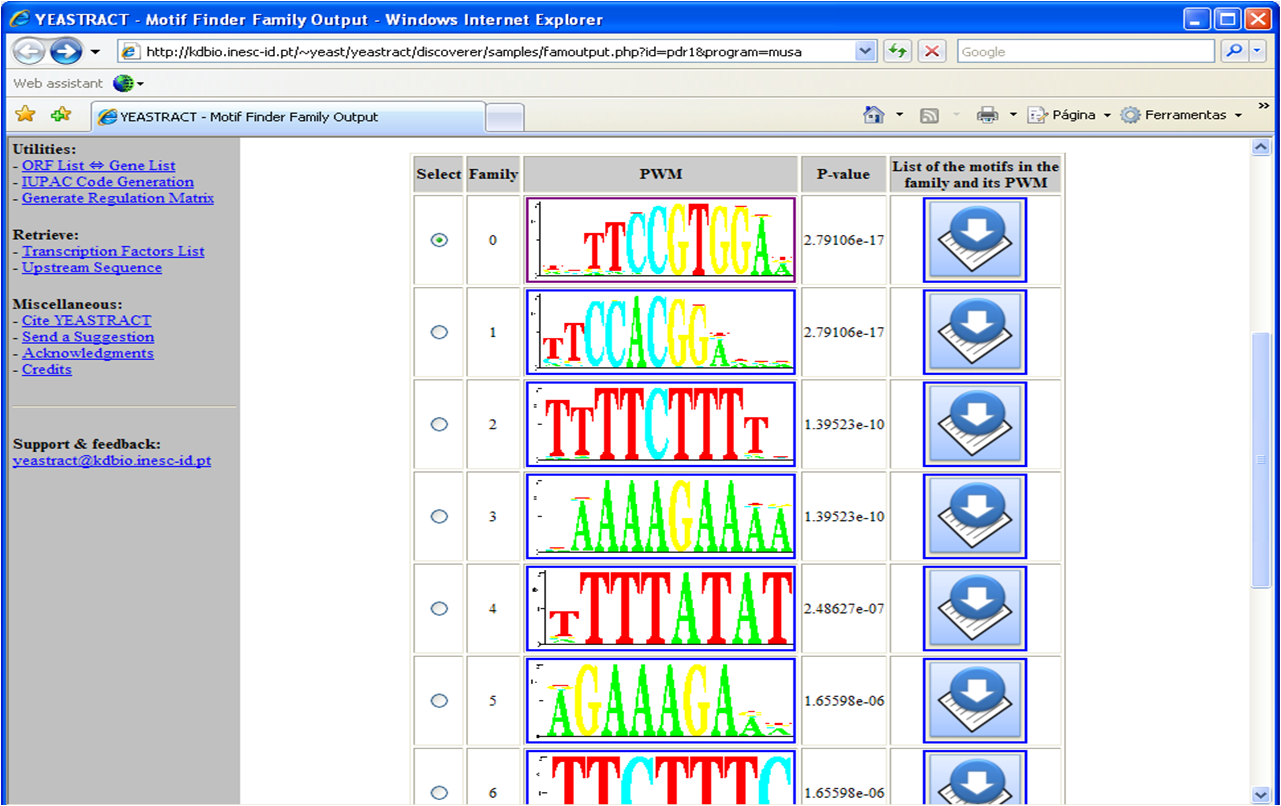 Figure 1
: Depiction of the result obtained from the use of MUSA to discover the families of
over-represented DNA motifs in the promoter regions of the deRisi gene-list.
As depicted in Figure 1, each extracted motif is associated to a p-value,
which indicates its statistical significance.
The given p-value corresponds to the lowest p-value attributed to the motifs in the family, which can be seen by clicking the "notebook and arrow" icon (Figure 2).
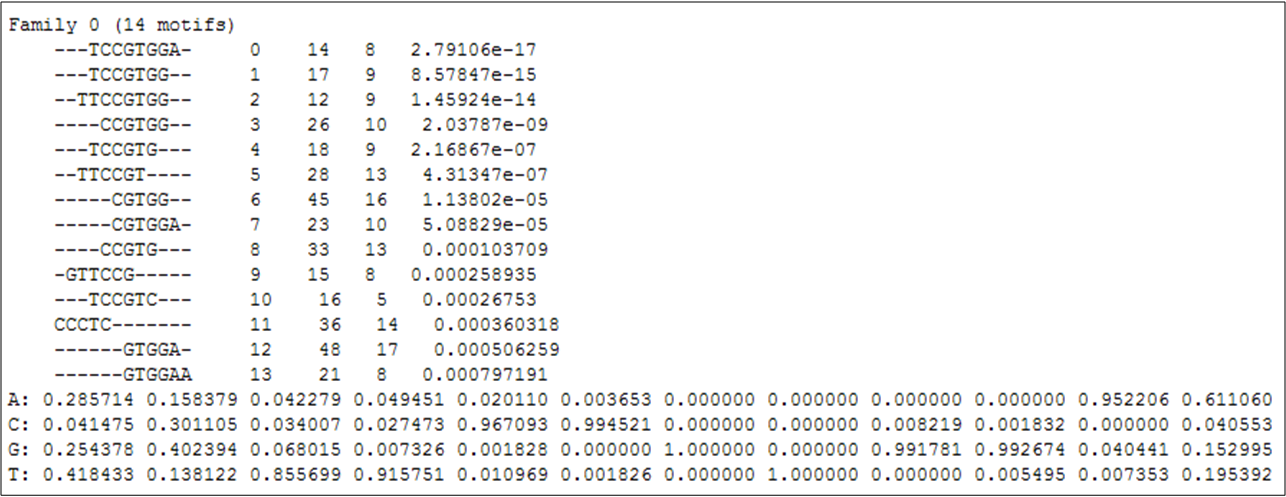 Figure 2
: List of DNA motifs over-represented in the promoter regions of the deRisi gene-list,
which are clustered as the most significant DNA motif family.
Figure 2 shows the 14 motifs which contribute to the most significant family of over-represented motifs in the de Risi gene-list.
By selecting the first PWM and clicking the "Match" icon at the bottom of the page represented in Figure 1, a comparison between the
PWM of that motif family and the transcription factor binding sites deposited in YEASTRACT is obtained (Figure 3).
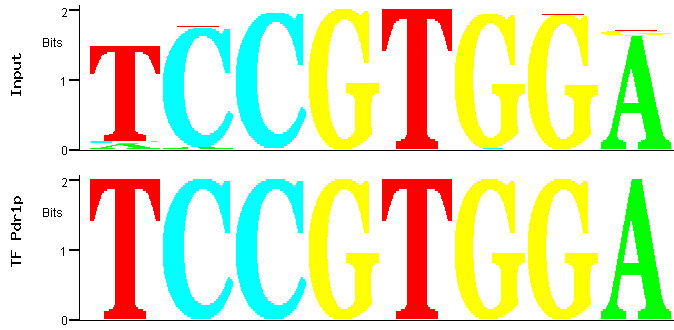 Figure 3
: Match between predicted (input) and documented Pdr1p binding site.
Figure 3 shows that the best match between this PWM and the YEASTRACT TFBS
is precisely one of the documented Pdr1p-binding sites [2]. Significantly, the Pdr1p binding
site is also an exact match to the most significant motif extracted by MUSA, the first in the PWM motifs family list, see Figure 2.
By selecting the second PWM and clicking again in the "Match" icon in the bottom of the page represented in Figure 1, a comparison between the
PWM of the family corresponding to the second most significant identified over-represented motif and the transcription factor binding sites deposited in YEASTRACT is obtained (Figure 4).
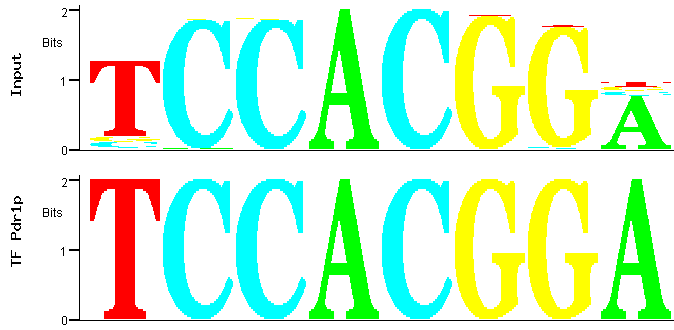 Figure 4
: Match between predicted (input) and documented Pdr1p binding site.
Figure 4 shows that the best match between the PWM of the family of the second most significant motif over-represented
among the promoters of the Pdr1p-target genes is again one of the documented Pdr1p-binding sites [2]. It is a motif similar
to the first but not included in the same family because the difference lies upon central nucleotides: an AC switched for a GT. In fact, as MUSA is
searching for motifs on both strands of the promoters (by default), this second family roughly contains the reverse complement of the motifs contained
in the first family.
This is a fine example, because it shows a perfect match between predicted and verified Pdr1p binding sites. The algorithm MUSA proves to be very
accurate providing predicted transcription factor binding sites, without any need for the user to manipulate search parameters. Of course, in this
show-case the obtained result is merely confirmatory. However, this tool is expected be very useful in the study of new transcription factors
for which no binding site has yet been proposed.
Nonetheless, even with a very good motif-discovery algorithm, a perfect match is not always obtained, particularly when dealing with a larger
gene-list, some times comprising hundreds of putative targets for a single transcription factor. Such case is considered in the following example.
3. Example 2: Identification of the putative Aft2p binding site, based on direct and indirect evidence
In this second example, the targets of transcription factor Aft2p, involved in the regulation of iron homeostasis and associated oxidative stress
[3], are considered. According to the data deposited in YEASTRACT, Aft2p has 193 documented targets. There is evidence
supporting the direct binding of Aft2p to the promoter region of many of these 193 target-genes [4]. However, for some of them
evidence of a regulatory association is indirect, coming from the comparison of gene transcript levels in the wild type and in a mutant devoid of
AFT2 [5]. Since the gene-list used in this example includes direct and indirect targets of Aft2p, the motif discovery results may
present some inaccuracy due to the noise associated to the starting data.
The dataset used in this example can be found here and the output obtained can be found here.
Using MUSA to analyse the referred Aft2p-target list, without changing any of the default parameters, results in a table displaying the identified
motifs, clustered in families and represented by a Position Weight Matrix description (Figure 5). Presumably, the first motif(s) obtained will
correspond to the Aft2p binding site.
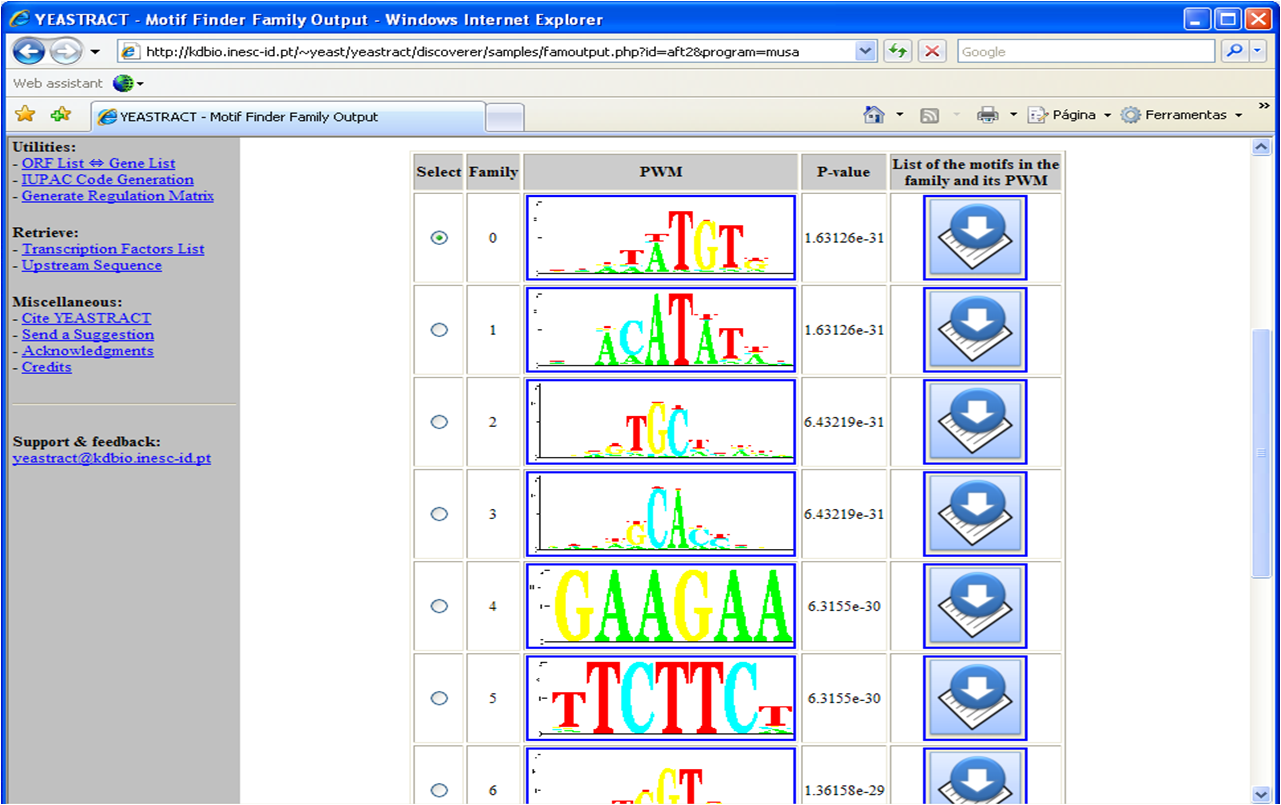 Figure 5
: Depiction of the families obtained from the use of MUSA to discover the over-represented
DNA motifs in the promoter regions of the Aft2p target-genes.
By selecting each PWM and clicking the "Match" icon at the bottom of the page (Figure 5),
a comparison between the PWM of the identified
over-represented motifs and the transcription factor binding sites deposited in YEASTRACT is obtained. For the first three PWMs in
Figure 5, the alignment appears rather poor (Figure 6)
and has a low score (6.4 out of a maximum of 10), possibly indicating that there is no described transcription factor binding site with such characteristics.
Although these elements are not the expected documented Aft2p binding site, they may represent new regulatory motifs associated to this transcription factor.
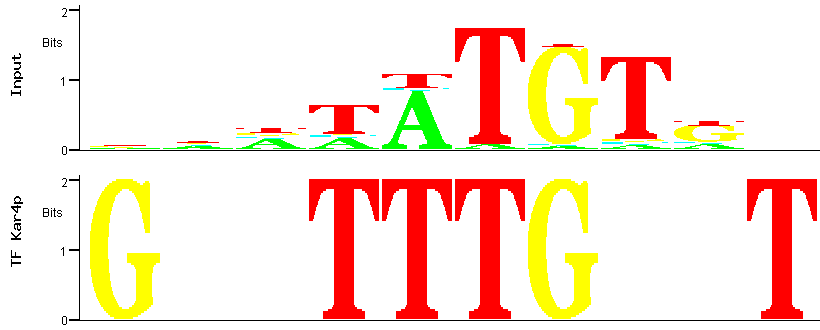 Figure 6
: Alignment between the predicted (input) Aft2p binding site (the one with the smallest p-value)
and the binding site for the Kar4p transcription factor.
To further investigate the existence of a TFBS similar to the PWM of the first family, the PWM can be trimmed. Trimming removes the
edges of the PWM with low
information content, considering only the more informative columns of the PWM for the alignments(Figure 7).
Trimming is therefore advisable when the PWM has many low information content columns on either extremity, allowing for better matches to the more
important PWM core.
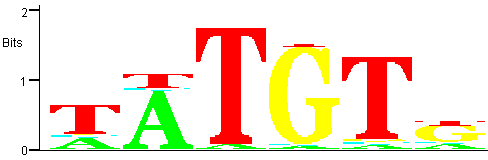 Figure 7
: Trimmed PWM for the family corresponding to the most significant motif.
By selecting the checkbox "Trim" and selecting
the threshold at 0.3 the best match produced corresponds to that shown in Figure 8.
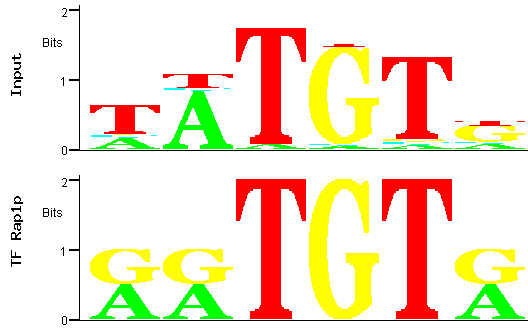 Figure 8
: Alignment between the trimmed predicted (input) Aft2p binding site (the one with the smallest p-value)
and the binding site for the Rap1p transcription factor.
In this case a score closer to the maximum is obtained (4.79 out of a maximum of 6), indicating a better alignment. However, the input PWM aligns only
with a short part of the Rap1p TFBS, which motivates us to search further for a PWM originating a better match with a described TFBS.
If we repeat the match step (using the Trim with a threshold value of 0.3) for the fourth DNA motif, we get a more expectable result
(Figure 9). This alignment scores closer to the maximum score (4.5 out of 5)
and the overlap between the PWM and the TFBS is greater than in the previous alignment.
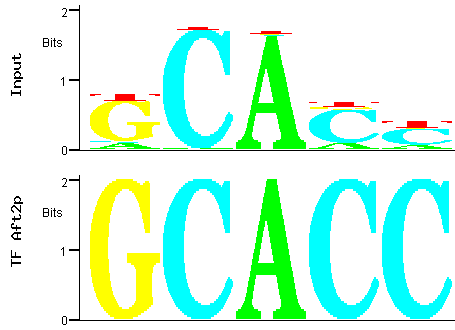 Figure 9
: Alignment between the trimmed predicted (input) Aft2p binding site
(the fourth PWM in the table) and the binding site for the Aft2p transcription factor.
Figure 9 shows that one of the best matches between the PWM containing the fourth most
significant motif over-represented among the promoters of the Aft2p-target genes is precisely the documented Aft2p-binding site
[5,6]. It is interesting to note that the binding site described for this transcription factor
allows some variability in the peripheral nucleotides, while the DNA motif found by MUSA also exhibits a central conserved core region (CACCC),
flanked by less conserved tangential nucleotides.
It is also interesting to see that the core of the Aft2p binding site appears among the most significant DNA motifs,
found through MUSA (Figure 10).
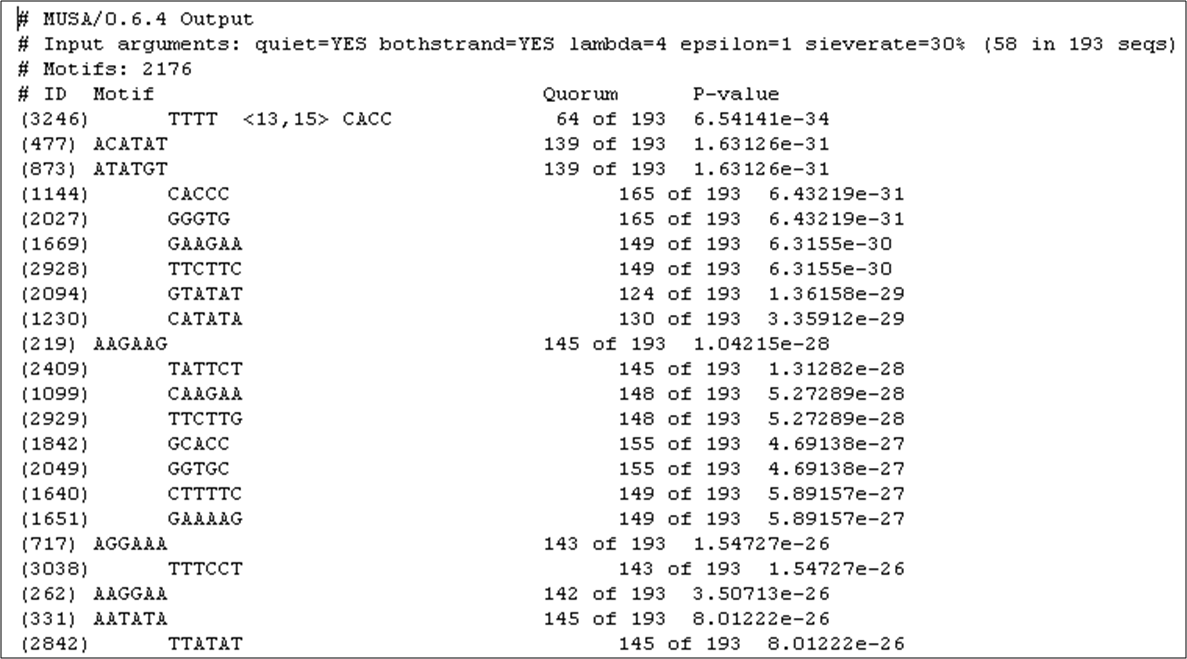 Figure 10
: List of the DNA motifs found to be over-represented in the promoter regions of 193 targets of Aft2p, ordered by statistical significance.
The fourth most significant motif is precisely the core of the Aft2p binding site. As shown in Figure 10,
it occurs in 139 out of 193 promoters of the presumable targets of this transcription factor.
We believe that this second example is closer to what most of the users of YEASTRACT-DISCOVERER will carry out, since most datasets are noisy and
large-scale. Although in this case, compared to the previous example (Example 1), results seem less clear, they are still
remarkably good. Based on the motif discovery algorithm MUSA, it was possible to find the documented Aft2p binding site and suggest new
putative binding sites for this transcription factor. This example shows that even for more noisy datasets this approach can provide
interesting clues on how transcription factors interact with their target genes.
4. References
[1]
Mendes N.D., Casimiro A.C., Santos P.M., Sá-Correia I.,
Oliveira A.L., Freitas A.T.,
MUSA: A parameter free algorithm for the identification of
biologically significant motifs,
Bioinformatics, 22, 2996-3002, 2006
[2]
DeRisi, J., van den Hazel, B., Marc, P., Balzi, E., Brown, P., Jack, C., Goffeau, A., 2000, Genome microarray analysis of transcriptional activation in multidrug resistance yeast mutants.
FEBS Letters 470: 156-160.
[3]
Blaiseau, P.L., Lesuisse, E. and Camadro, J.M., 2001, Aft2p, a novel iron-regulated transcription activator that modulates, with Aft1p, intracellular iron use and resistance to oxidative stress in yeast.
J Biol Chem 276(36):34221-6.
[4]
Harbison, C.T. et al., 2004, Transcriptional regulatory code of a eukaryotic genome.
Nature 431(7004):99-104.
[5]
Courel, M., Lallet, S., Camadro, J.M. and Blaiseau P.L., 2005, Direct activation of genes involved in intracellular iron use by the yeast iron-responsive transcription factor Aft2 without its paralog Aft1.
Mol Cell Biol 25(15):6760-71.
[6]
Rutherford, J.C., Jaron, S. and Winge, DR., 2003, Aft1p and Aft2p mediate iron-responsive gene expression in yeast through related promoter elements.
J Biol Chem 278(30):27636-43.
|


